Safety is not equal
Some parents who work essential jobs, such as emergency room doctors, had to find childcare in a hurry this March. Suddenly, daycare centers and schools were shuttered. It was dangerous for children to be together and then to go home to their families every afternoon. Working parents, the ones who had the means, adapted.
As parents returned to work this summer, some day cares opened, and school openings were being planned. Work-from-home parents and unemployed parents had more time to consider options. What to do about schooling is a hot topic among professional parents this summer.
But for other parents, the pandemic brought no change to their childcare routine for their pre-schoolers. Many had after-school care for their school-aged kids that was not disrupted. These parents were working, but were not earning enough to send their children to professional childcare. They could never afford it.
Have you thought about who takes care of the grocery store clerk’s children? It’s not paid childcare–not for $15 an hour or (much) more. Extended families, by blood or affinity, do childcare for people who get paid about the same or even less than childcare workers.
The hardest-hit towns in Massachusetts for Covid-19 infection were towns with many essential workers in them. This is where grocery workers, delivery people, and those who are essential, but not well-paid, live. When childcare businesses closed, it didn’t affect people whose children went to Millie down the street when Mommy went to work. The disruption came when someone brought Covid-19 into that extended family.
The higher rates of infection in moderate and low income towns continued in Massachusetts into the summer. Many of these towns have been on the top of this list for highest infection rates throughout the pandemic.
Among cities and towns with at least 15 new cases [during the last two weeks of July], these 25 communities have the highest percentages of positive cases in that time period:
| Community | Number of cases | Cases in the last 14 days | Total tests in the last 14 days | Positive tests in the last 14 days | Percent of positive tests in the last 14 days |
| Lynn | 3,858 | 129 | 3,985 | 175 | 4.39% |
| Brockton | 4,364 | 59 | 1,898 | 79 | 4.16% |
| Fall River | 1,756 | 67 | 2,367 | 97 | 4.10% |
| Everett | 1,843 | 42 | 1,384 | 54 | 3.90% |
| Chelsea | 3,036 | 56 | 1,993 | 75 | 3.76% |
| Belchertown | 121 | 15 | 421 | 15 | 3.56% |
| Chicopee | 509 | 39 | 1,416 | 47 | 3.32% |
| Lawrence | 3,760 | 79 | 3,249 | 104 | 3.20% |
| Framingham | 1,802 | 36 | 1,520 | 47 | 3.09% |
| Saugus | 579 | 16 | 792 | 23 | 2.90% |
| Springfield | 3,033 | 95 | 4,126 | 118 | 2.86% |
| Quincy | 1,231 | 51 | 2,256 | 62 | 2.75% |
| Marlborough | 1,029 | 27 | 1,443 | 37 | 2.56% |
| Needham | 352 | 15 | 821 | 21 | 2.56% |
| Malden | 1,302 | 31 | 1,623 | 39 | 2.40% |
| Falmouth | 229 | 22 | 1,014 | 24 | 2.37% |
| Methuen | 1,077 | 24 | 1,315 | 31 | 2.36% |
| Holyoke | 980 | 30 | 1,622 | 38 | 2.34% |
| New Bedford | 2,223 | 37 | 2,184 | 49 | 2.24% |
| Worcester | 5,483 | 119 | 6,785 | 148 | 2.18% |
| Westfield | 483 | 16 | 880 | 18 | 2.05% |
| Salem | 663 | 21 | 1,318 | 26 | 1.97% |
| Lowell | 3,022 | 52 | 3,615 | 71 | 1.96% |
| Boston | 14,667 | 296 | 20,272 | 389 | 1.92% |
| Barnstable | 391 | 17 | 920 | 17 | 1.85% |
Schools are not equal
American public schools are funded in part by Federal and State funds. However, they are heavily funded by municipal taxes that are not at all equal. Affluent people are attracted to “good schools,” and less affluent people cannot afford these “good schools.” At least, as far as home buyers are concerned, they continue to pay more and more to be in the districts that claim to have good schools.
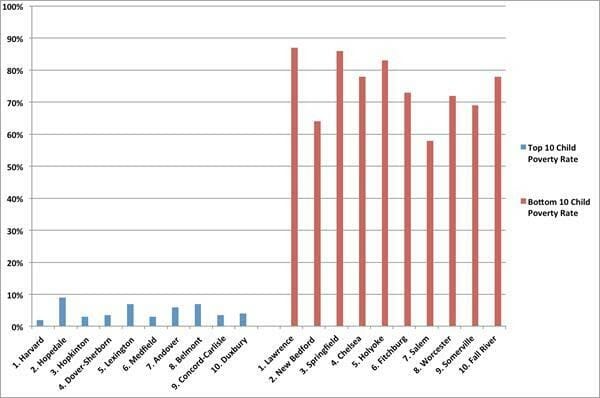
The correlation of scores with socioeconomic status is also demonstrated within Massachusetts. This chart shows the child poverty rate in the 10 districts with the highest MCAS scores (on the left), and those with the lowest.
This creates a self-perpetuating circle. Towns that are expensive attract middle-class and rich people, who are interested in education and willing to pay for it. Then the scores rise (or stay high), attracting more middle-class and rich people who are interested in education. Then the housing cost rises, attracting only richer and richer people. This has been going on for generations. That’s why, when a prospective house hunter looks at a local high school, the houses are more expensive where the school system offerings are more extensive.
Paul Reville, former Secretary of Education for Massachusetts, wrote in Education Week in June 2013: “We were going to eliminate the correlation between zip codes and educational achievement and attainment. I’m sorry to say that, two decades later, it is clear that we’ve failed.”
My state Senator, Pat Jehlen, recently published a newsletter about the minimum wage and education. The chart above was developed by her staff.
Starting from inequality, add Covid-19
Since March, schools have been online. This has disadvantaged many children. These problems are showing up in every school environment.
- Many children (and adults) have trouble working in Zoom/video learning environments.
- Some student services don’t adapt well to a Zoom/video environment. This is not limited to children who are already identified as having special needs.
- Teachers cannot monitor how well children are concentrating in the Zoom/video environment. Children who are having concentration problems because of Zoom/video or generally don’t concentrate well can get left behind.
Add to that, the inequities affecting low-income school districts and children in low-income families.
- Some children do not have use of a computer. Some districts can give out Chromebooks, but many can’t.
- Some children do not have internet access at home.
- Some children do not live in a house or apartment big enough to afford them a quiet place to attend online classes.
Schools as social safety nets
- Schools provide an environment for children to gather and learn social skills with their age peers.
- School hours allow parents to accomplish things that they might not when the children are at home.
- Schools also provide a different adult input into a child’s life. This may be purely social-emotional, another adult paying attention. Teachers and school staff sometimes identify problems with children that their parents miss. These may range from noticing learning patterns or social anxieties all the way to identifying physical illness or child abuse.
- Schools provide meals for low-income children.
How much will children fall behind, if the pandemic affects school all the way through the 2020-2021 school year?